


Wednesday 20 December 2023
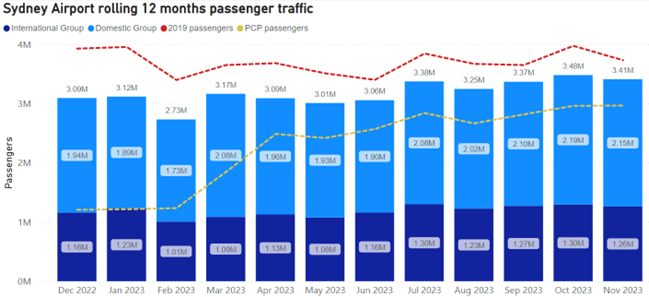
A total of 3.41 million passengers passed through Sydney Airport in November 2023, a 15.0% increase on passenger traffic in November last year and a 91.4% recovery compared to November 2019.
Sydney Airport’s T1 international terminal saw 1.26 million passengers pass through in November, a 29.8% increase on the same month last year and a 93.0% recovery rate on November 2019.
Domestic passenger traffic was up 7.8% on the same month last year, with 2.15 million passengers coming through the T2 and T3 domestic terminals in November.

Australians heading abroad
The number of Australian passport holders travelling abroad from Sydney Airport was only 1% off pre-pandemic levels in November.
While the number of passport holders from New Zealand, China, the US and UK were still below 2019 levels, the number of passengers from South Korea, India and the Philippines were all well above.
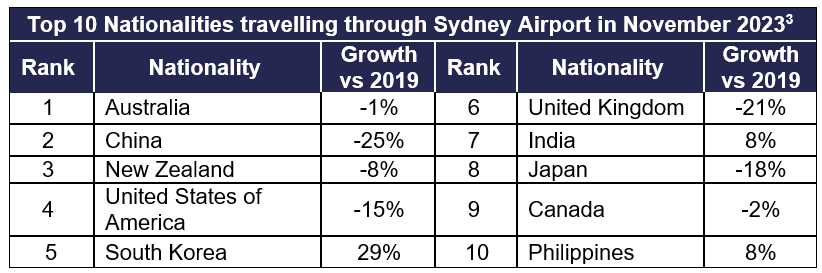
Sydney Airport CEO, Scott Charlton, said: “Australians’ desire for overseas travel is clearly back, with the number of Australian passport holders coming through the T1 international terminal returning to pre-pandemic levels.
“In terms of overseas visitors to Australia, passenger numbers are generally correlated to airline seat capacity. We are seeing strong passenger volumes from markets with high seat capacity, and where capacity is restricted, the recovery in passenger volumes has been slower.
“The same dynamic is at play domestically, where tighter airline capacity is translating to passenger volumes that are around 10 per cent lower than during the same period pre-pandemic.”
ENDS
-
Due to data availability, all international passenger numbers (including PCP, prior corresponding period comparisons) are based on Confirmed Airline Passenger (CAP) data. As per previous information releases, these figures may contain estimates with any adjustments to preliminary statistics included in the year-to-date results in future months
-
Includes Domestic-on-Carriage
-
All data is for arriving and departing international passengers. All data is taken from management accounts, is provisional and subject to revision. All data has been rounded to the nearest thousand and in some instances the total may not be equal to the sum of the parts. Percentage changes have been calculated based on actual figures